
Where Employee Tax Savings Go: Senior Care SIMRP Analysis

When employers implement a Self-Insured Medical Reimbursement Plan (SIMRP) under IRC § 105(b), executive discussions usually center on company savings.
However, evaluating the true return on investment requires looking at the employee allocation side: where do employee tax savings actually go once unlocked?
We analyzed benefit allocations across several senior care communities. The result was surprising. Skilled nursing staff didn't just go for the minor supplentmal policies, like accident expense or hospital indemnity. They tried to make the most sense out of a comprehesive benefit offering.
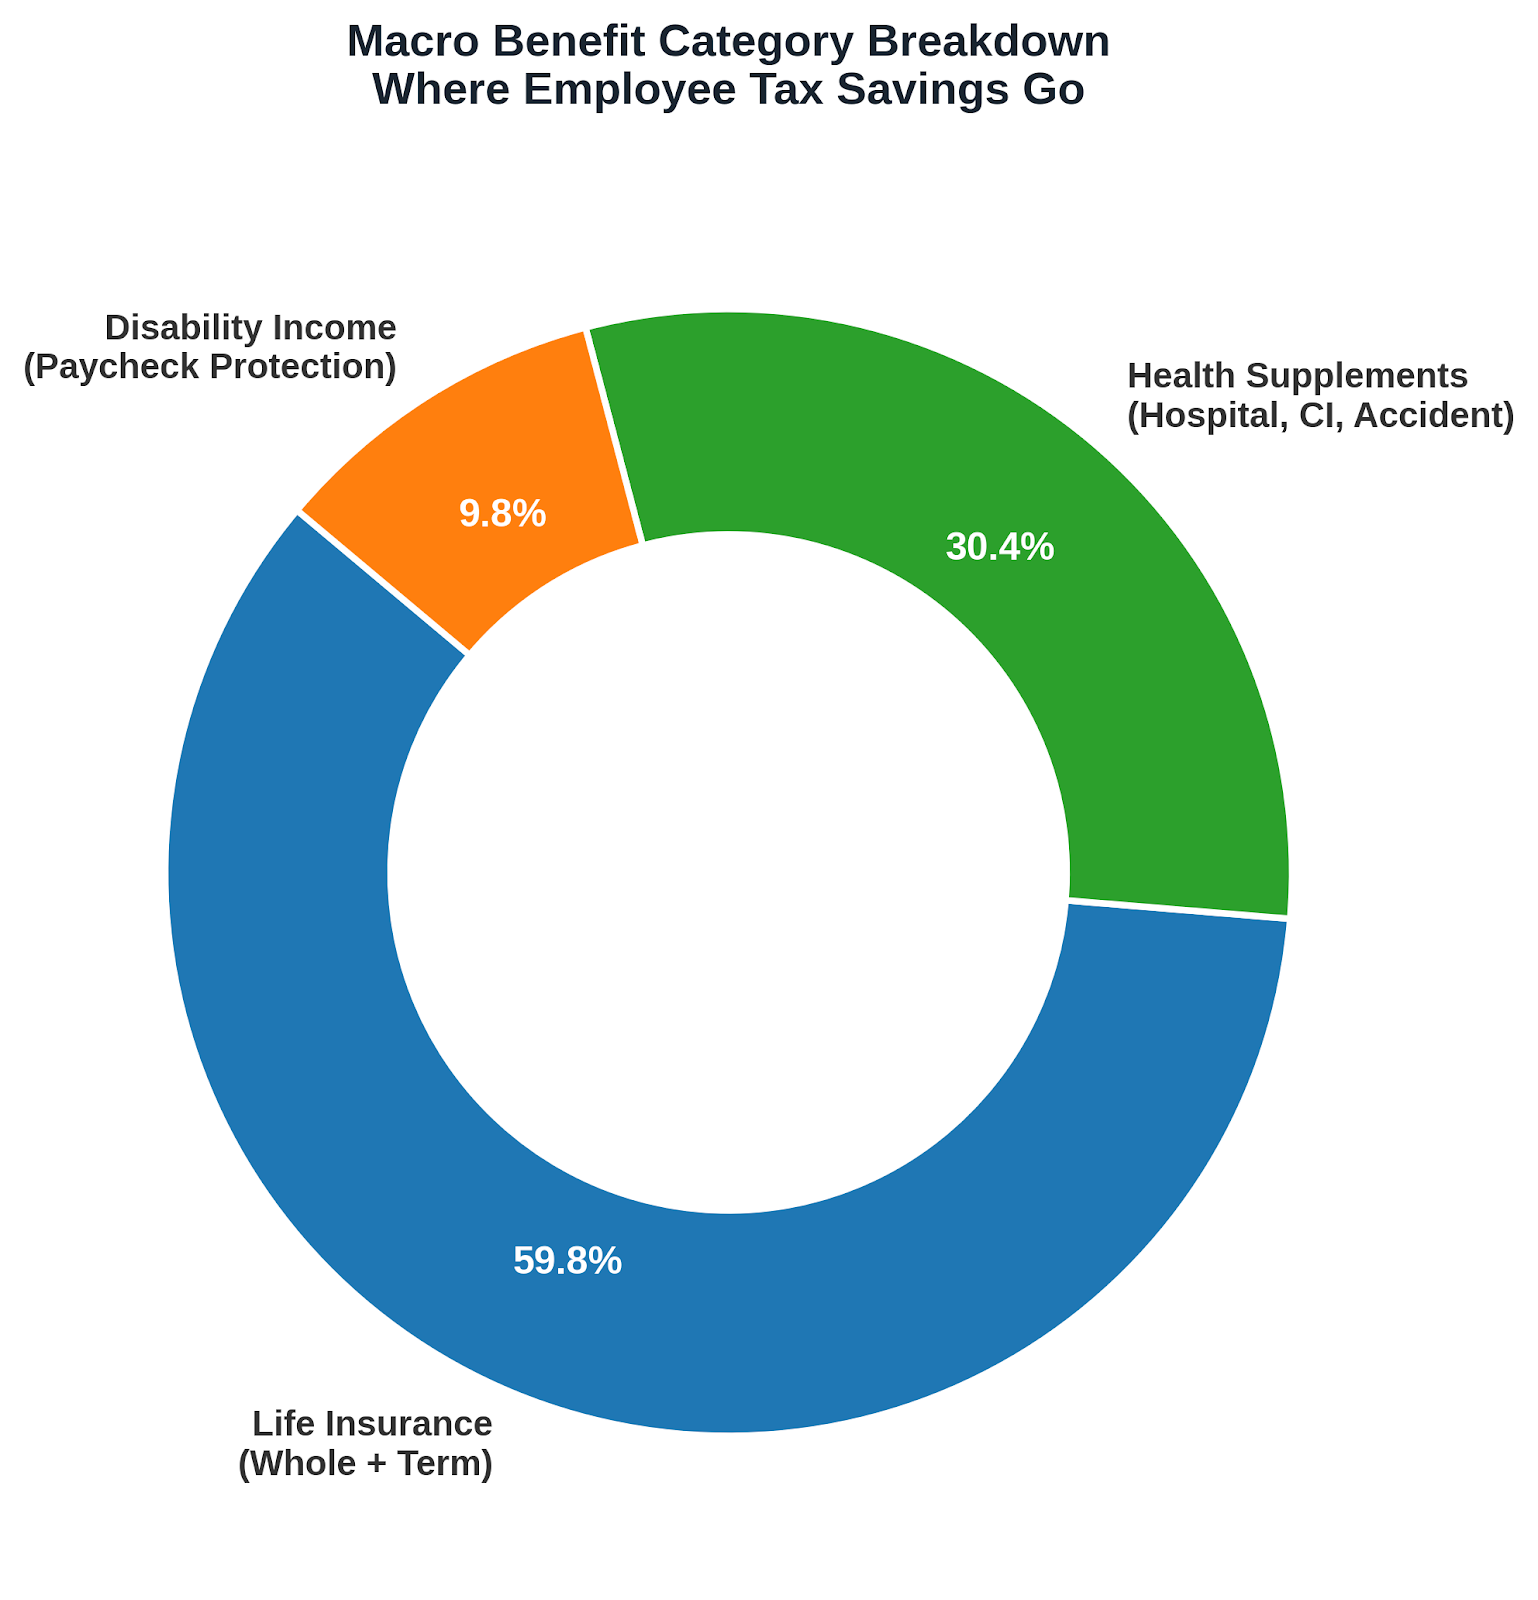
The Macro Picture: The Dollar-Weighted Reinvestment Reality
Unweighted group averages often create a distorted illusion that hourly healthcare workers only buy basic accident riders. A dollar-weighted analysis of active payroll allocations tells a very different story:
Life Insurance Dominates (59.8% of Allocations): Nearly 60% of every dollar unlocked through goes directly into Life Insurance. Both Term Life and Whole Life were selected at similar rates, should a awareness for a shared policy strategy
Accident Coverage is the Gateway: Accident plans are active in 100% of participating communities, but account for only 9.0% of total allocations. While accident plans don't cost as much in premium in comparison to the other policies, it serves as an intuitive, low-barrier entry point during open enrollment.
100% Full-Stack Engagement: Post-acute healthcare workers understand medical gaps better than almost any other demographic. When provided with a funding mechanism, they do not select piecemeal benefits they adopt the entire benefit stack.
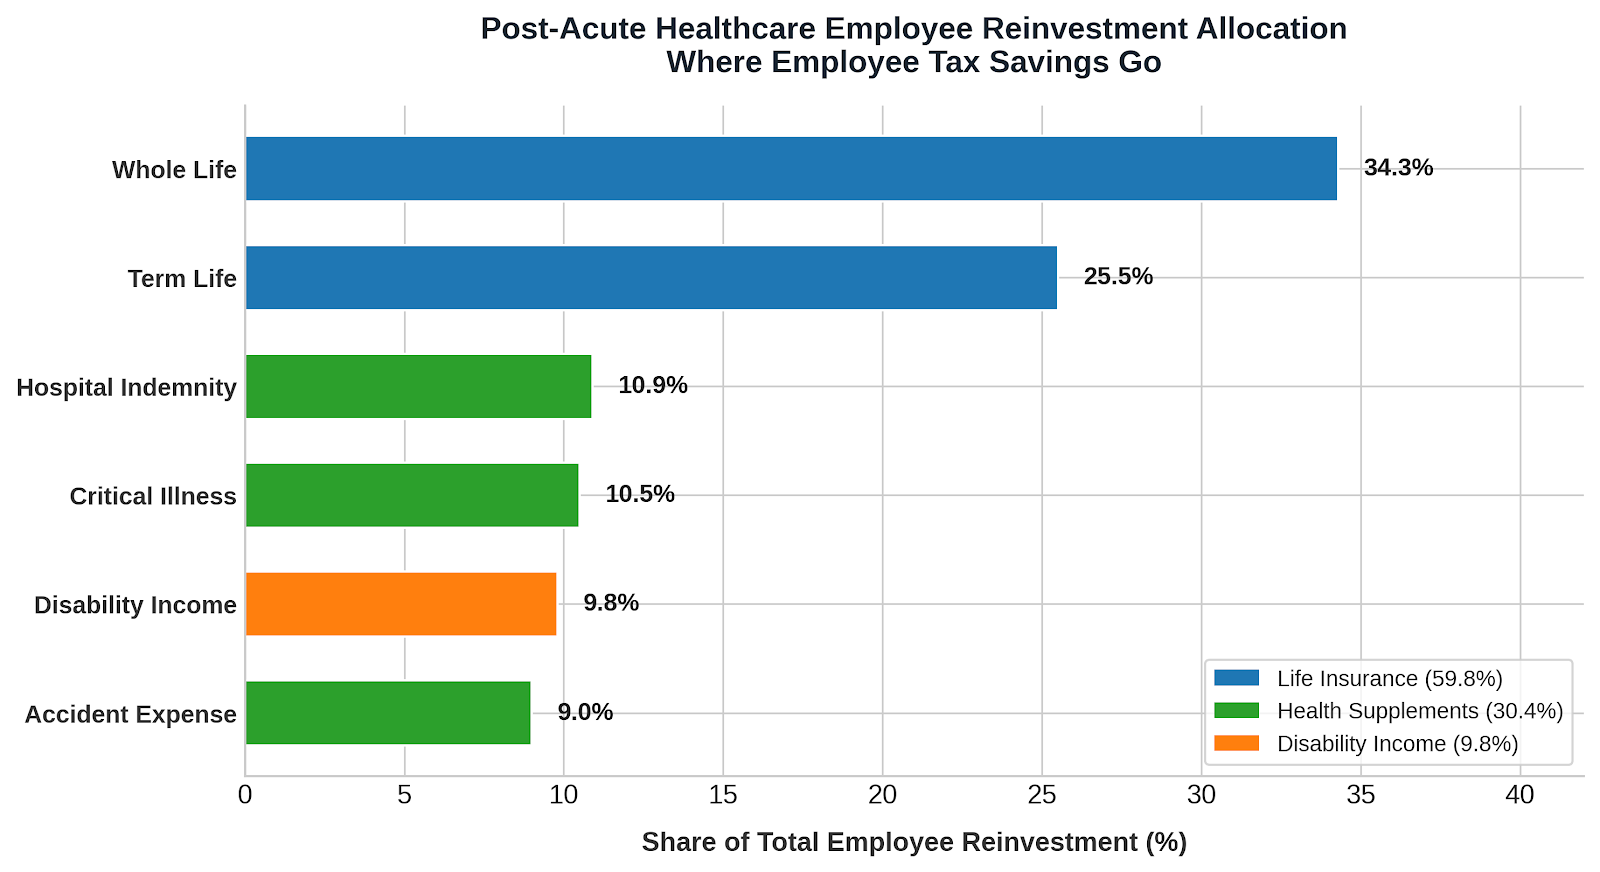
Financial Allocation Breakdown Across Healthcare Communities
Product Category | Specific Line | Share of Total Premium | Primary Strategic Purpose |
Life Insurance (59.8%) | Whole Life | 34.3% | Permanent cash-value accumulation & final expense safety net. |
Term Life | 25.5% | High-benefit income replacement during active working years. | |
Health Supplements (30.4%) | Hospital Indemnity | 10.9% | Direct cash reimbursement for inpatient hospital stays. |
Critical Illness | 10.5% | Lump-sum protection against catastrophic diagnoses (cancer, stroke, cardiac). | |
Accident Expense | 9.0% | First-dollar out-of-pocket protection for off-the-job injuries. | |
Disability Income (9.8%) | Short-Term Disability | 9.8% | Paycheck protection during extended medical leave or recovery. |
Key Industry Insights
1. The Full-Stack Signature
Across every skilled nursing community analyzed, 100% of groups enrolled in all six product lines (Accident, Critical Illness, Hospital Indemnity, Disability, Term Life, and Whole Life). Healthcare workers witness clinical events and hospital stays daily. When provided the budget, they close every exposure gap in their personal benefits package
2. Zero Disability Friction
In many corporate sectors, small headcounts and fluctuating part-time hours cause enrollment to stall at Guaranteed Issue (GI) minimums. Post-acute healthcare communities routinely clear these participation and hourly thresholds. Short-Term Disability was issued across 100% of communities, accounting for a stable 9.8% of total allocations. In long-term care, disability protection is an active, reliable line item.
3. High Product Consistency Across Facility Sizes
While a handful of flagship facilities account for over 60% of the total volume in this vertical, the remaining regional facilities maintain the exact same product mix. Facility scale impacts overall volume, but product selection proportions remain remarkably consistent across communities.
When structured under strict IRC § 213(d) compliance and supported by turnkey TPA administration, a Self-Insured Medical Reimbursement Plan achieves a dual objective: it delivers predictable FICA payroll tax relief to the employer while providing healthcare workers better access to care as well as financial security for their families.
Let Us Help
If you'd like to model your employer-side savings while seeing what your employees will gain in total benefits, check out out savings calculator here.

